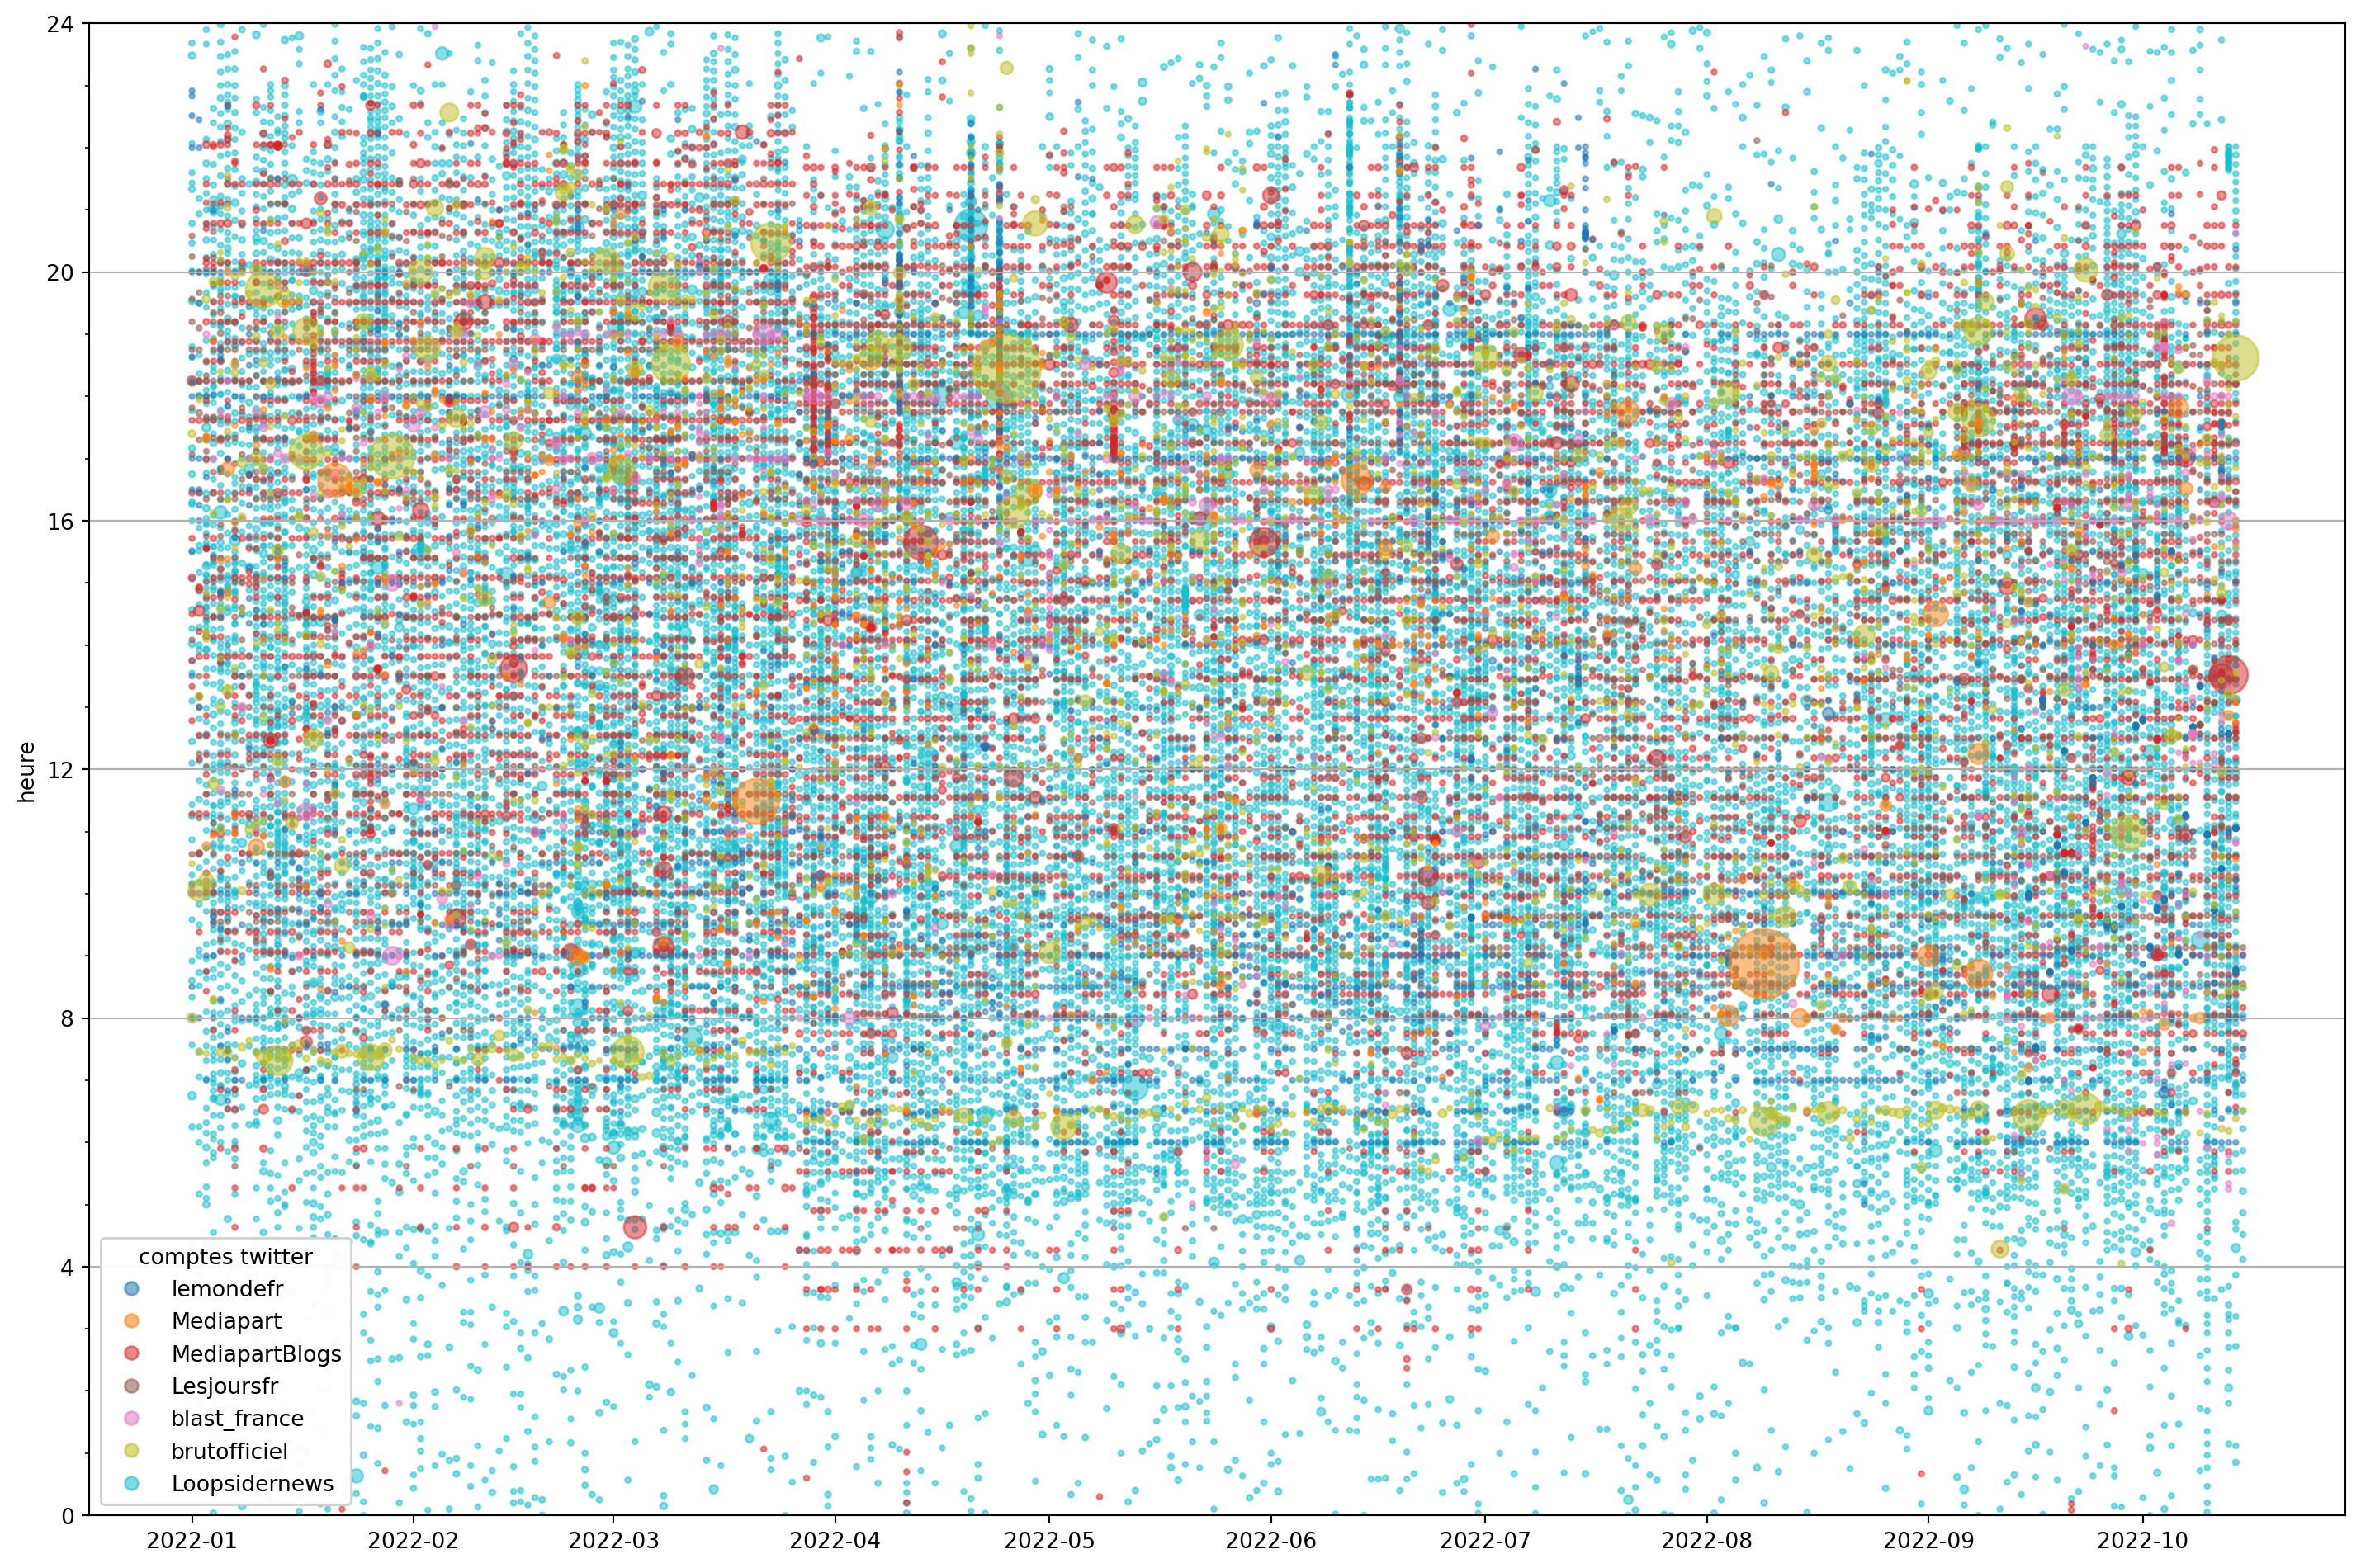
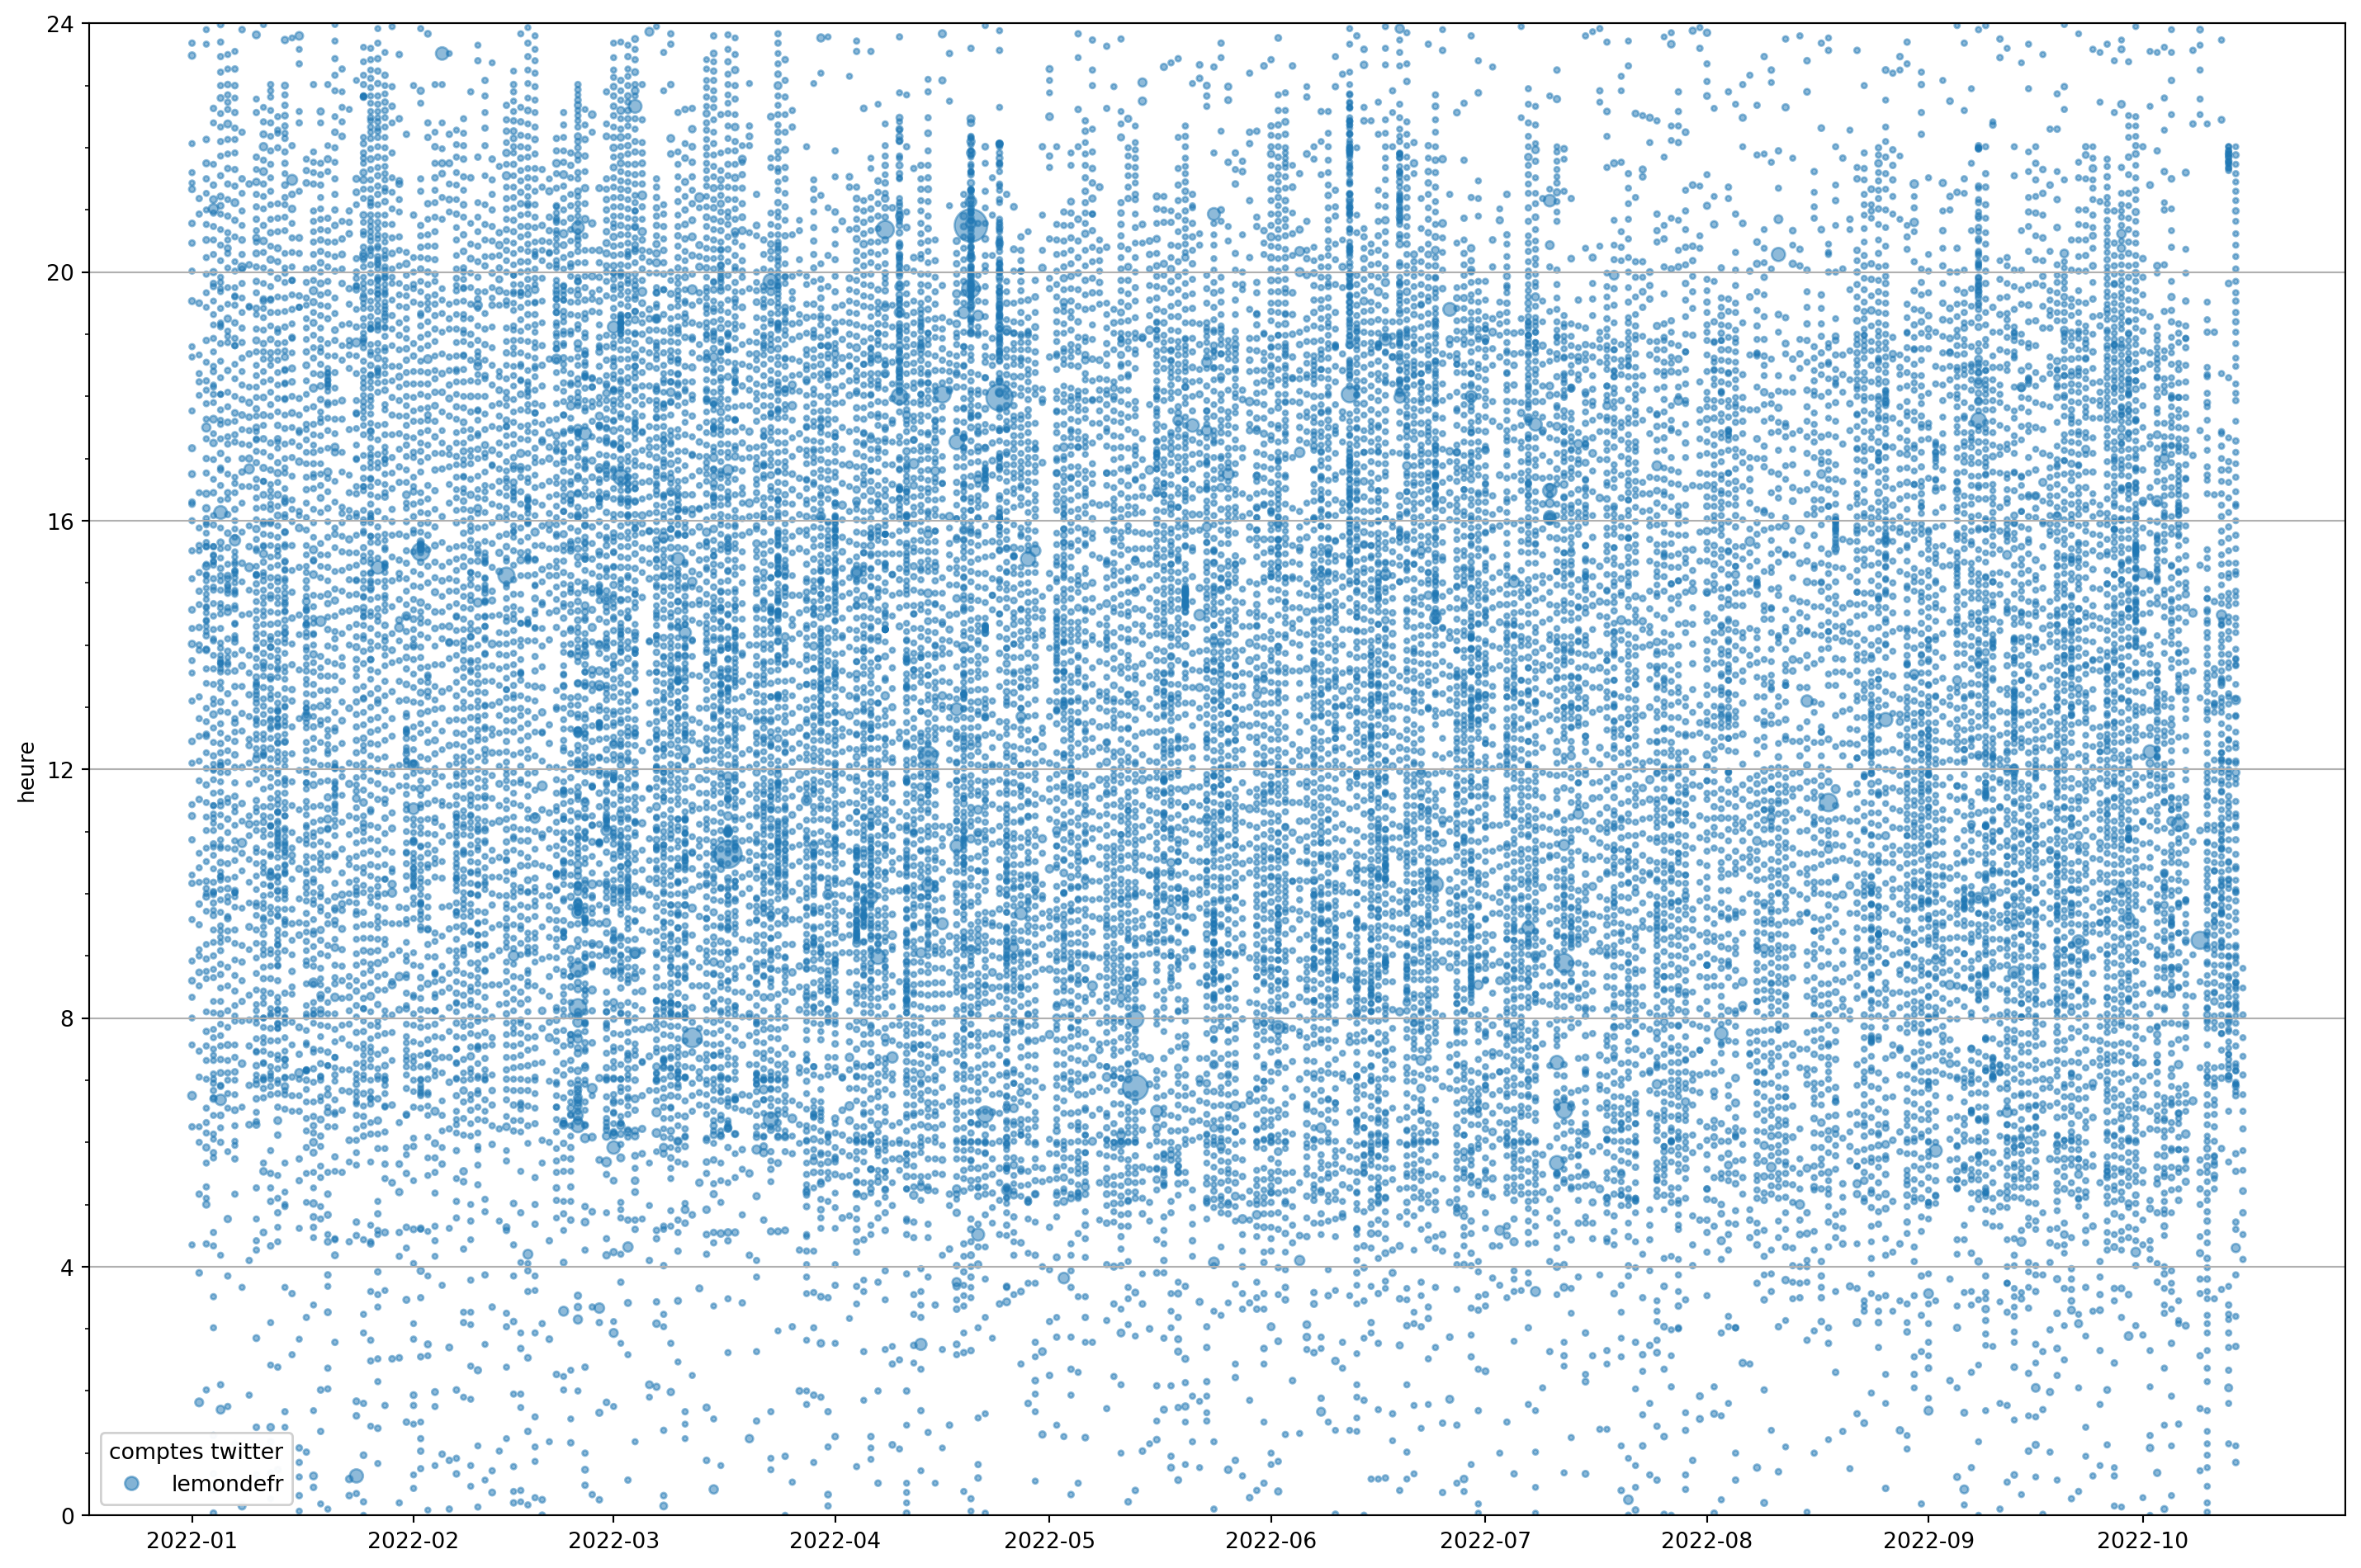
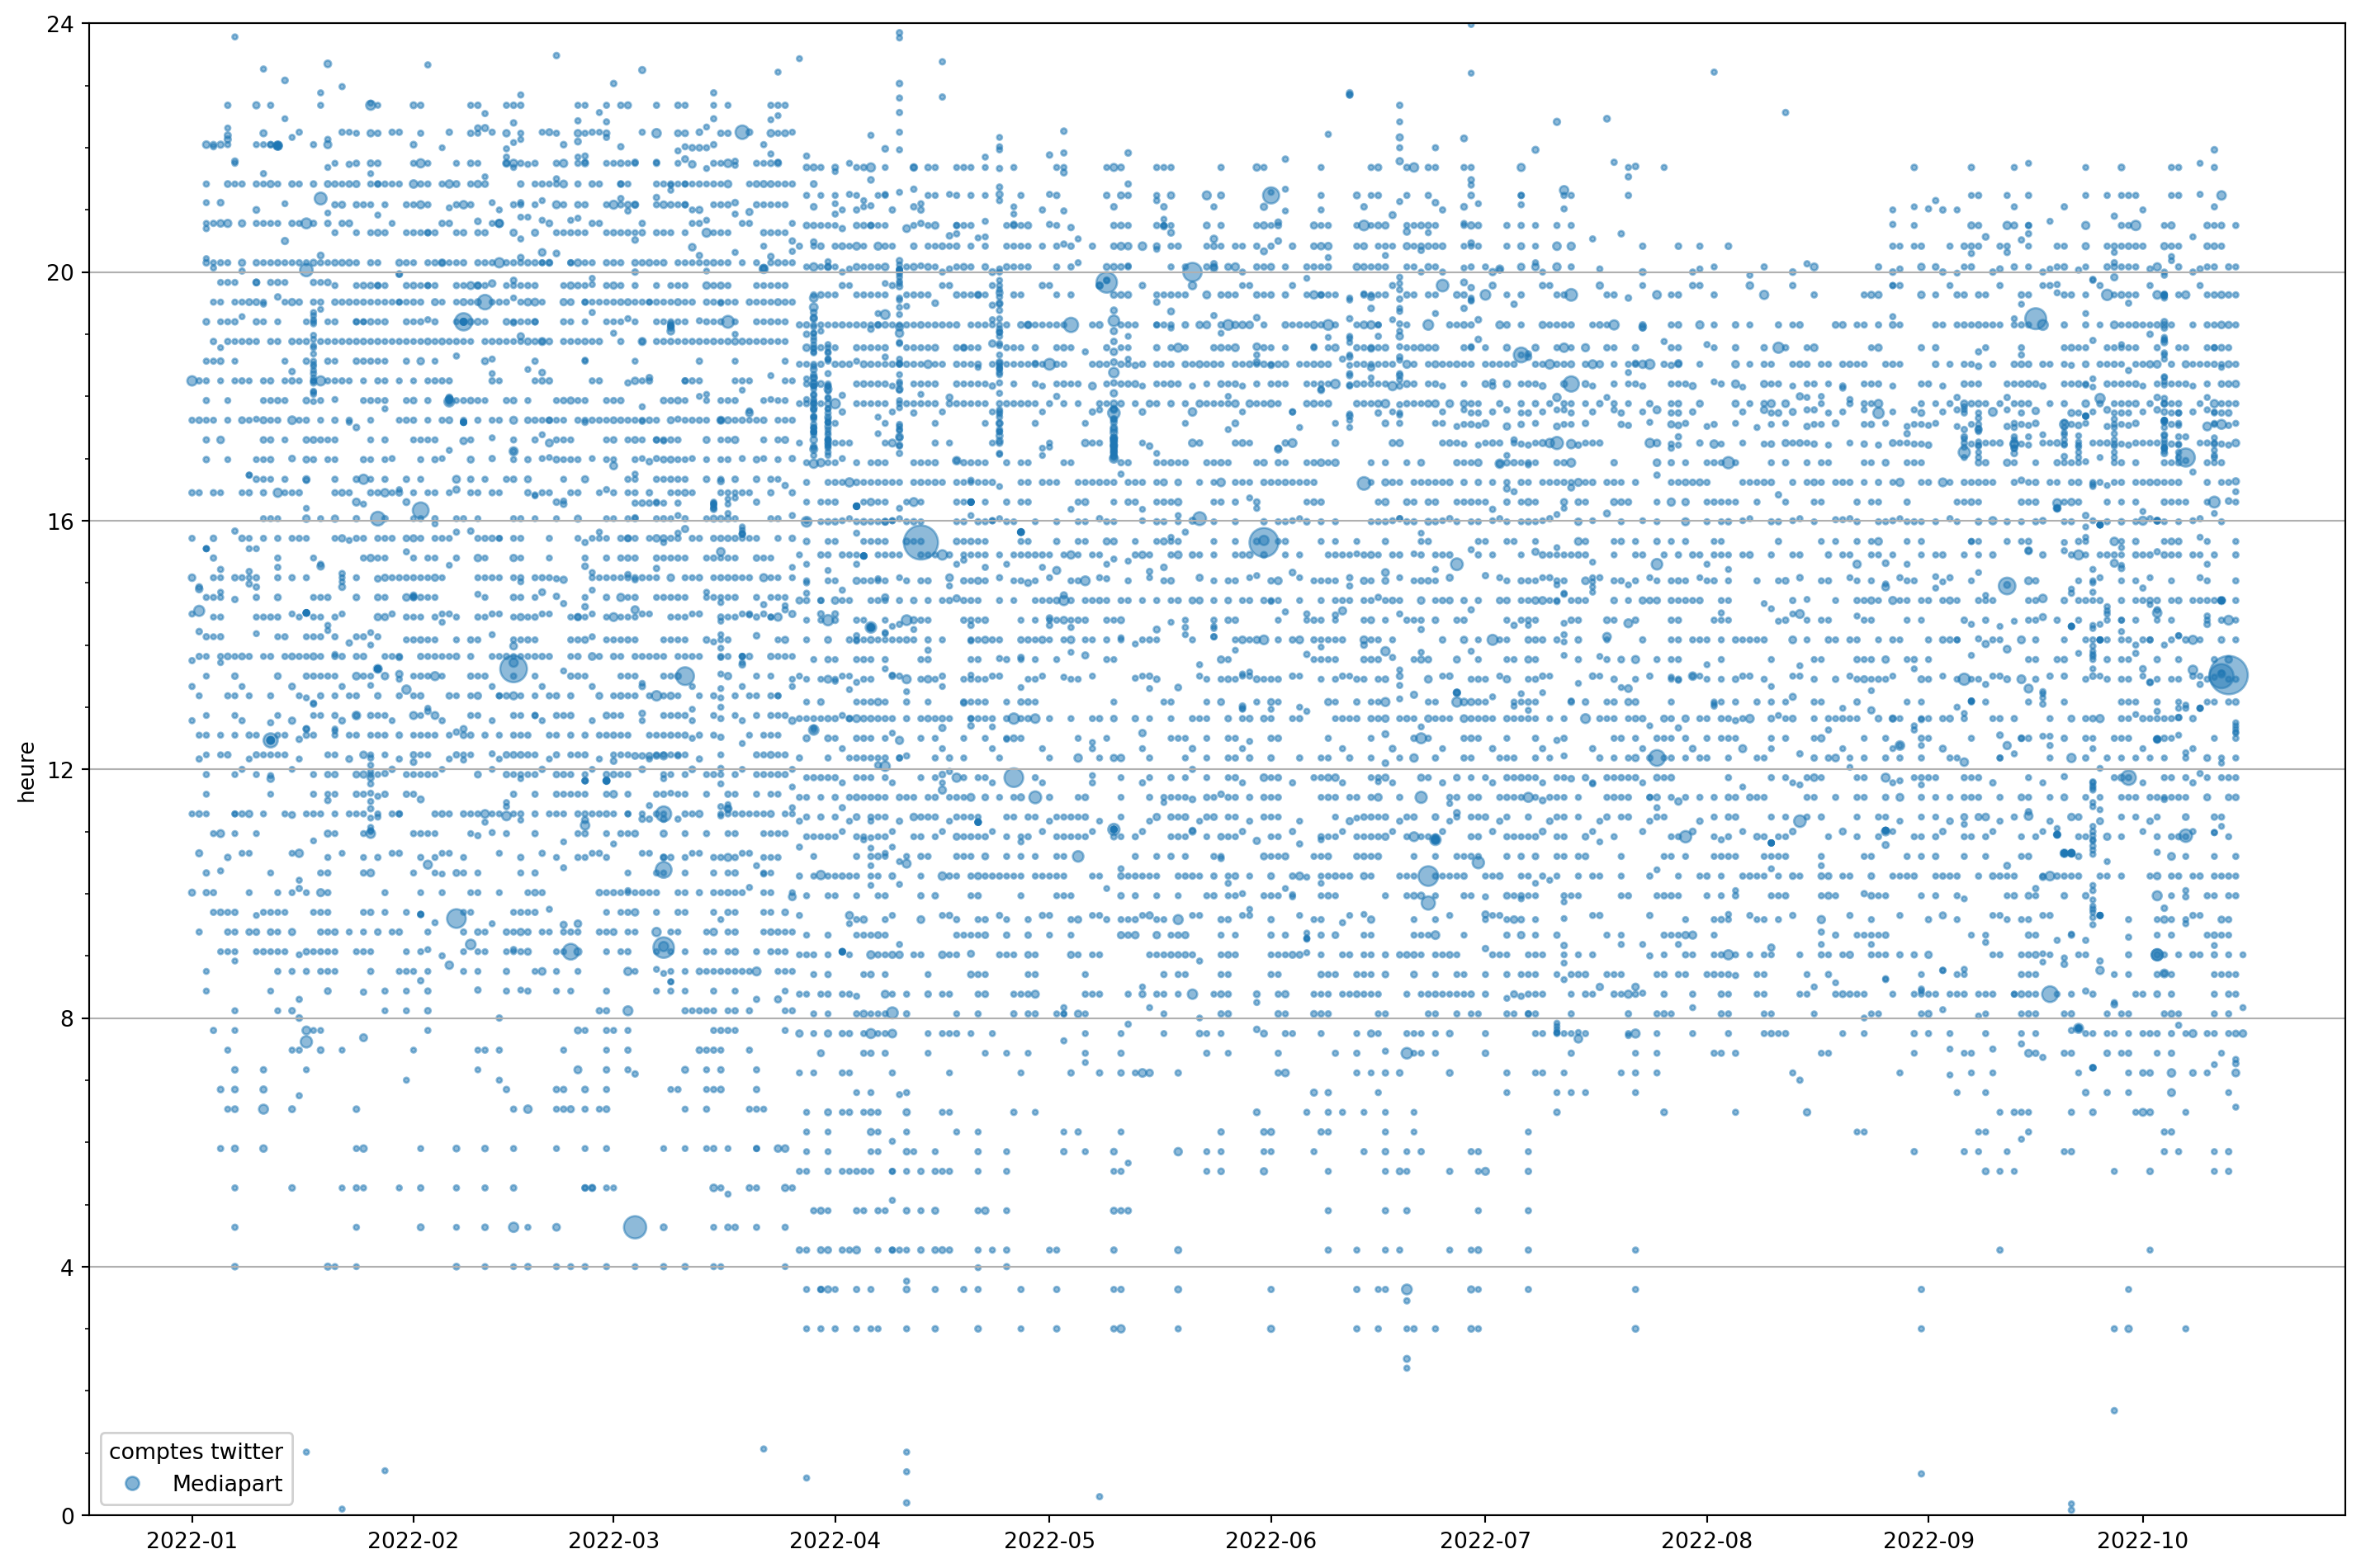
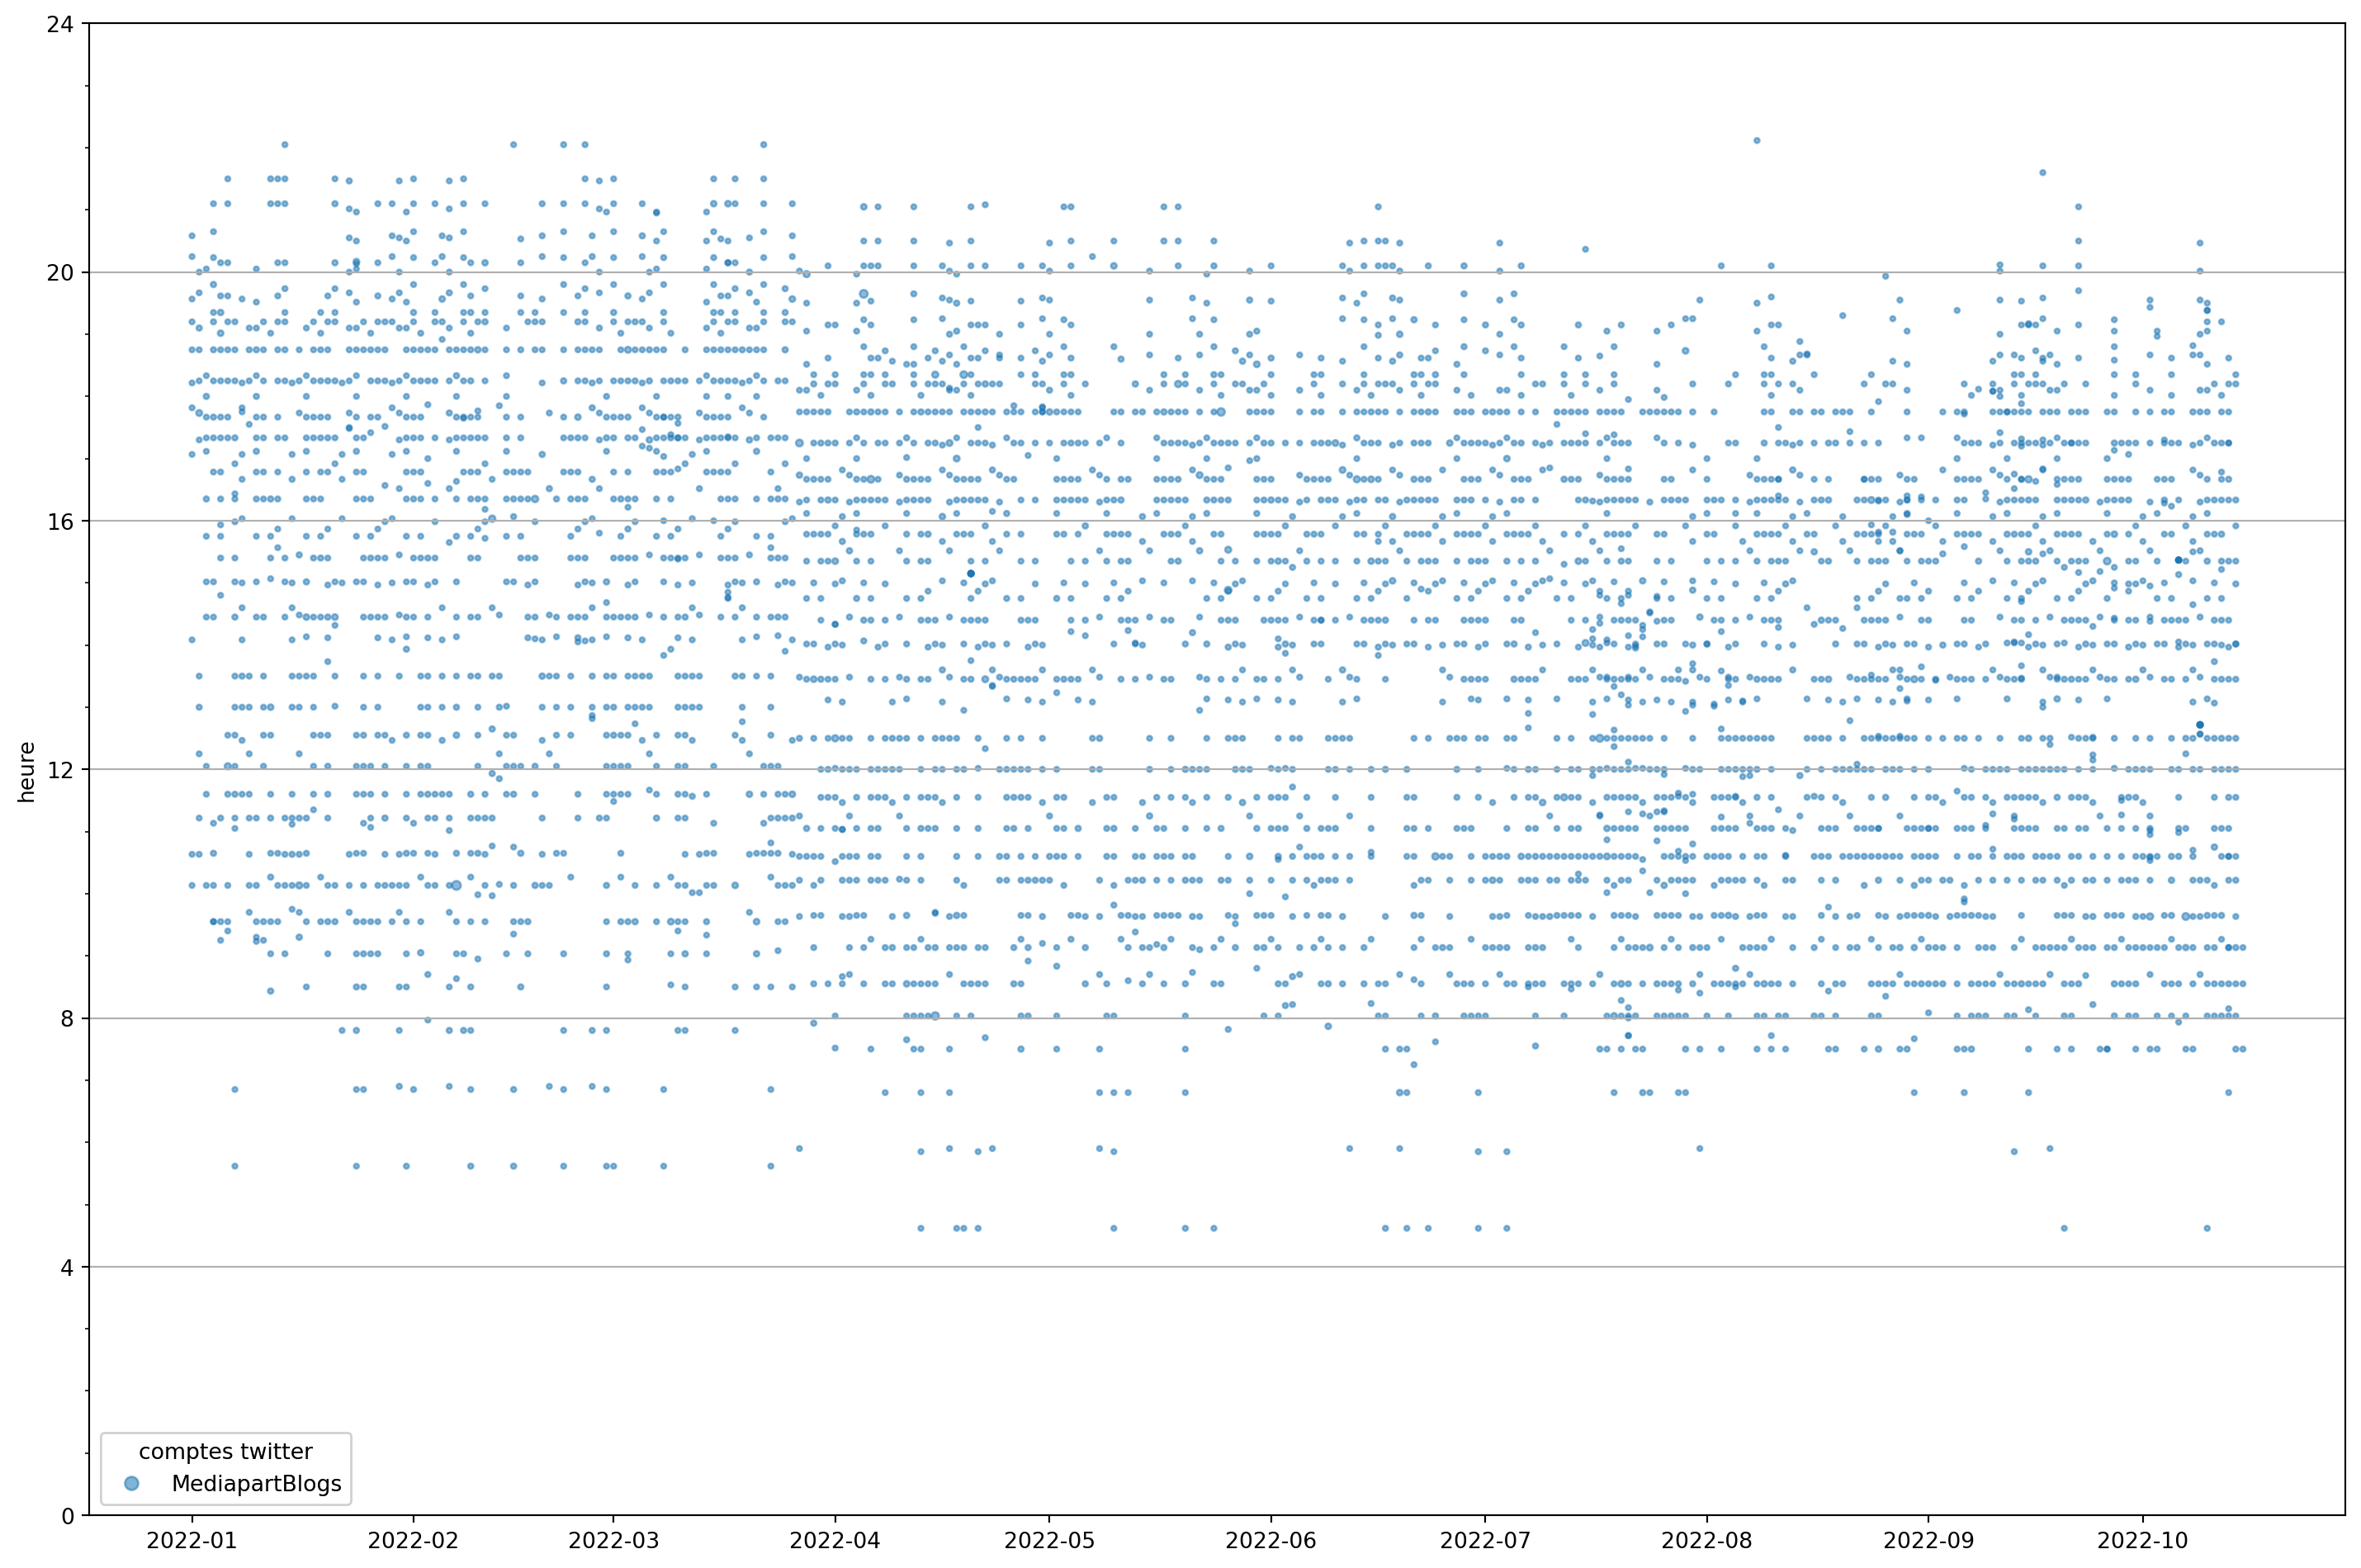
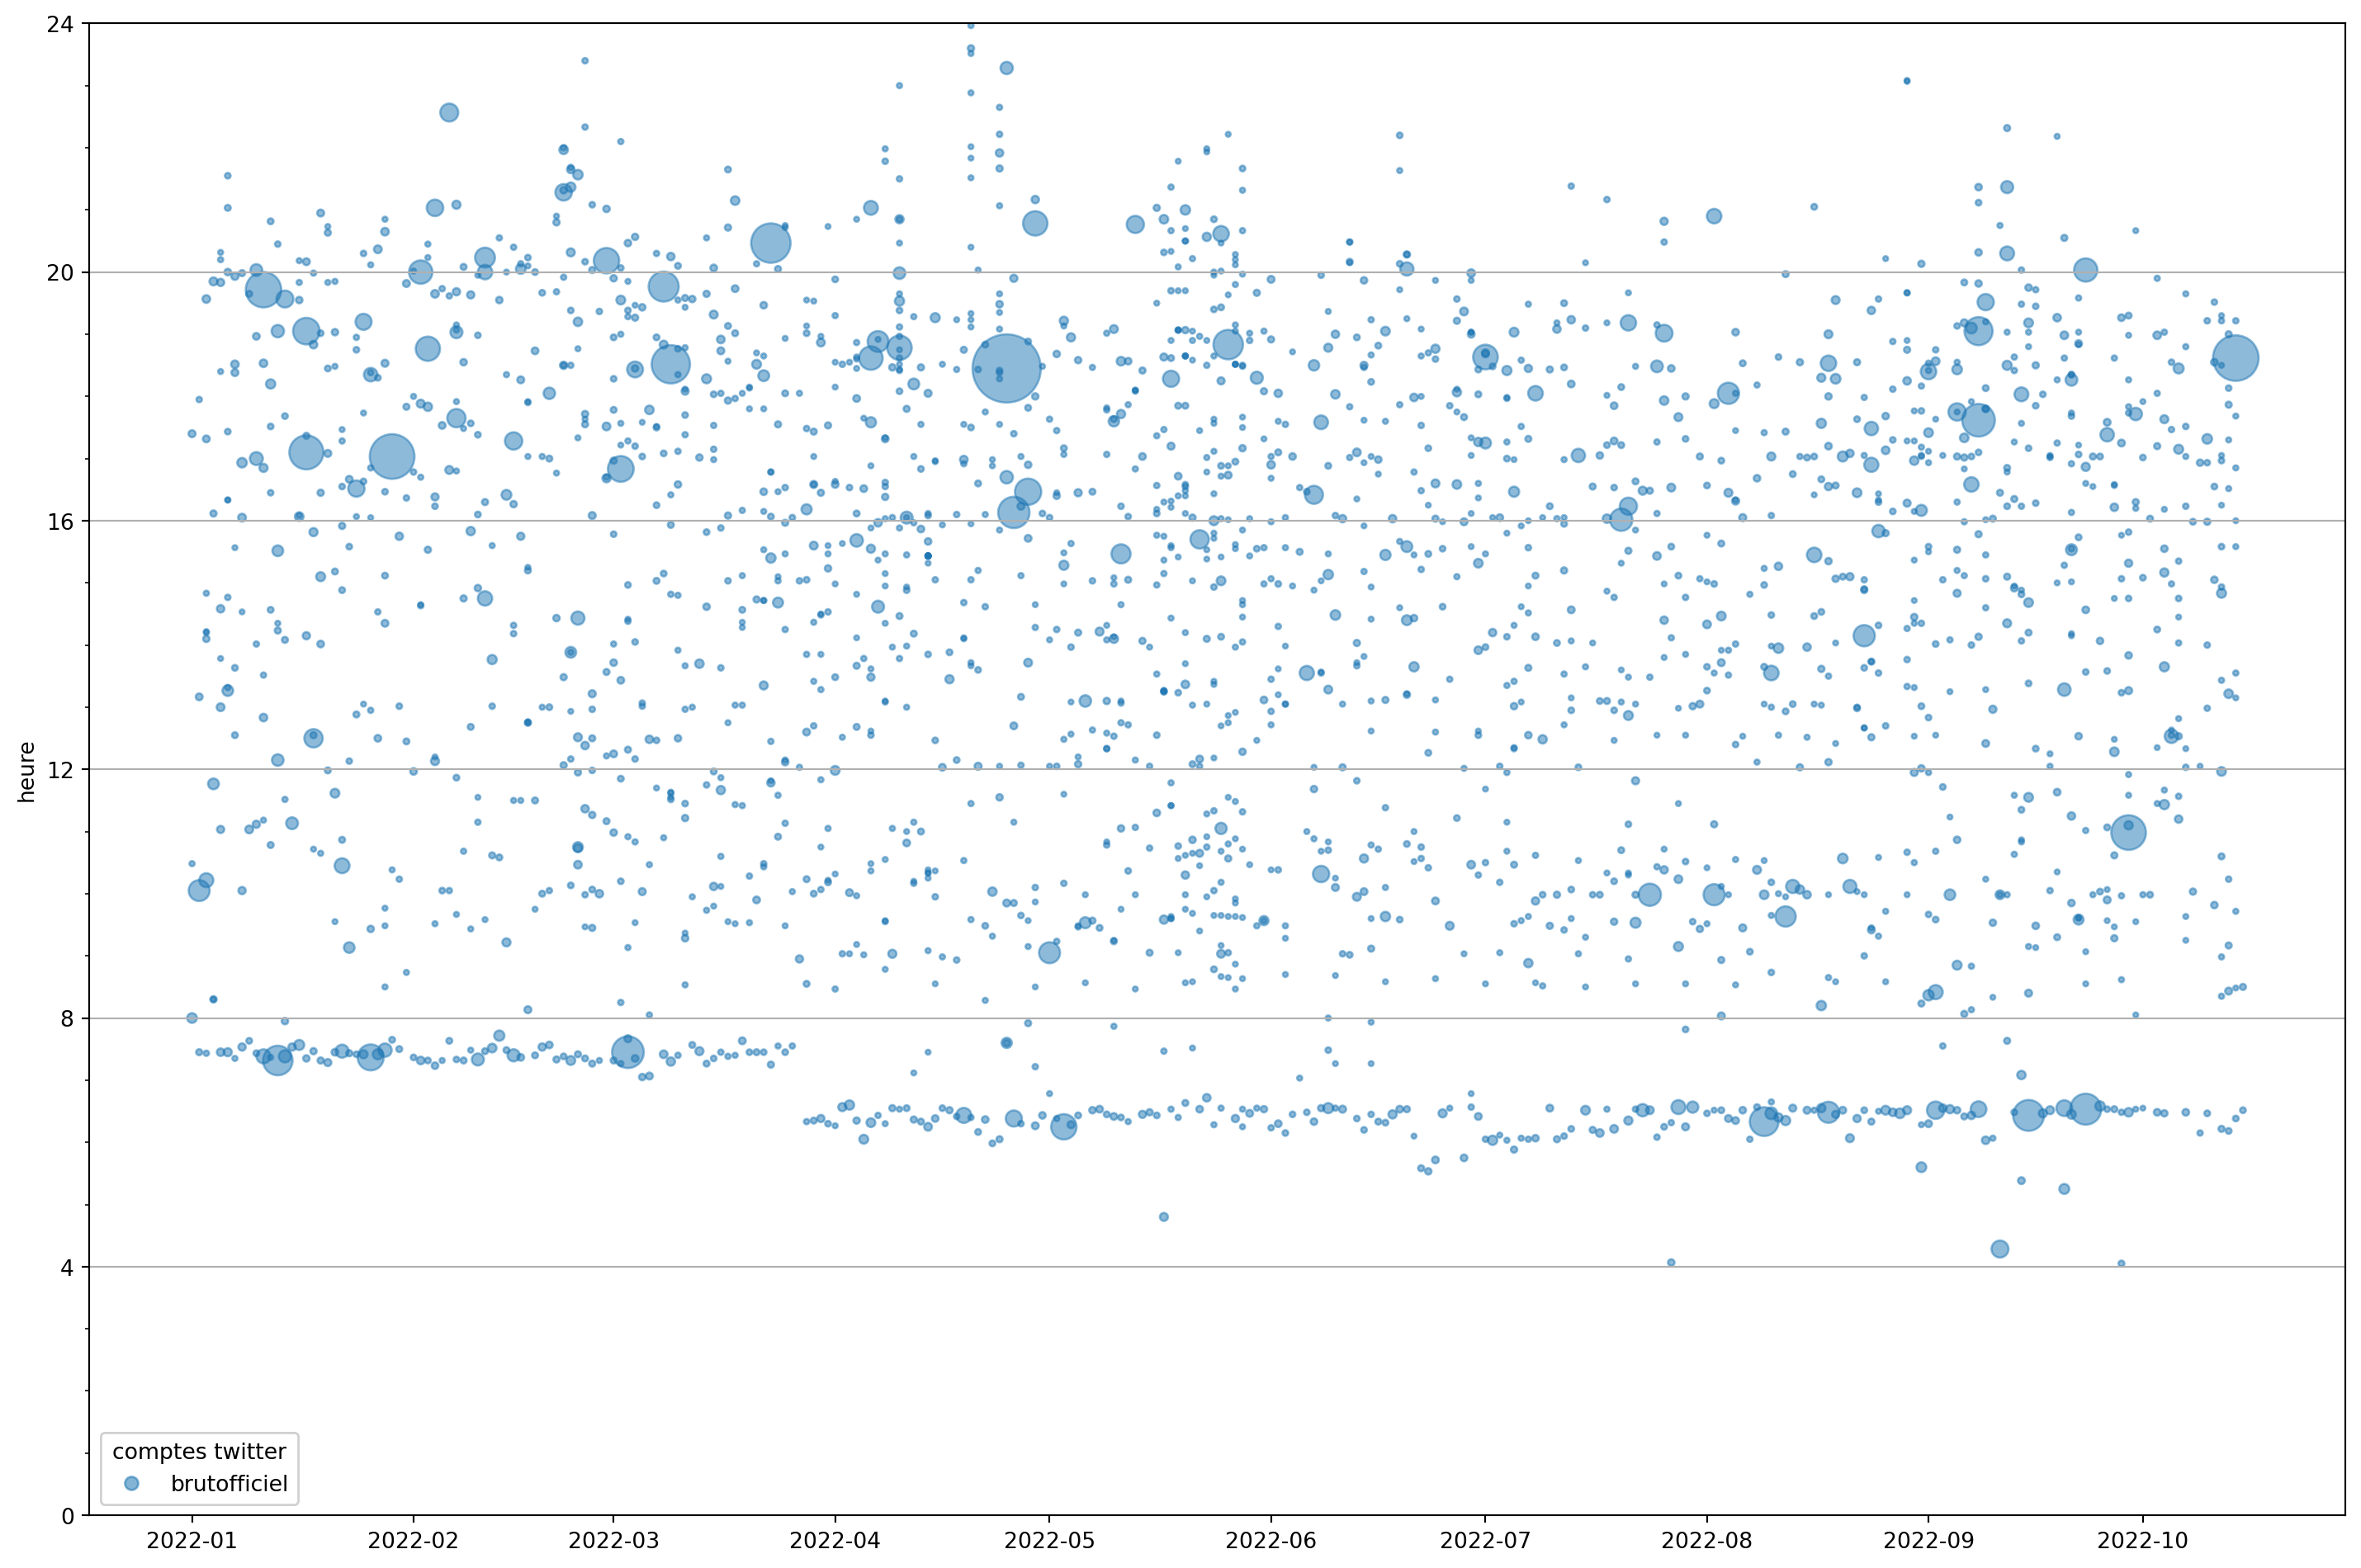
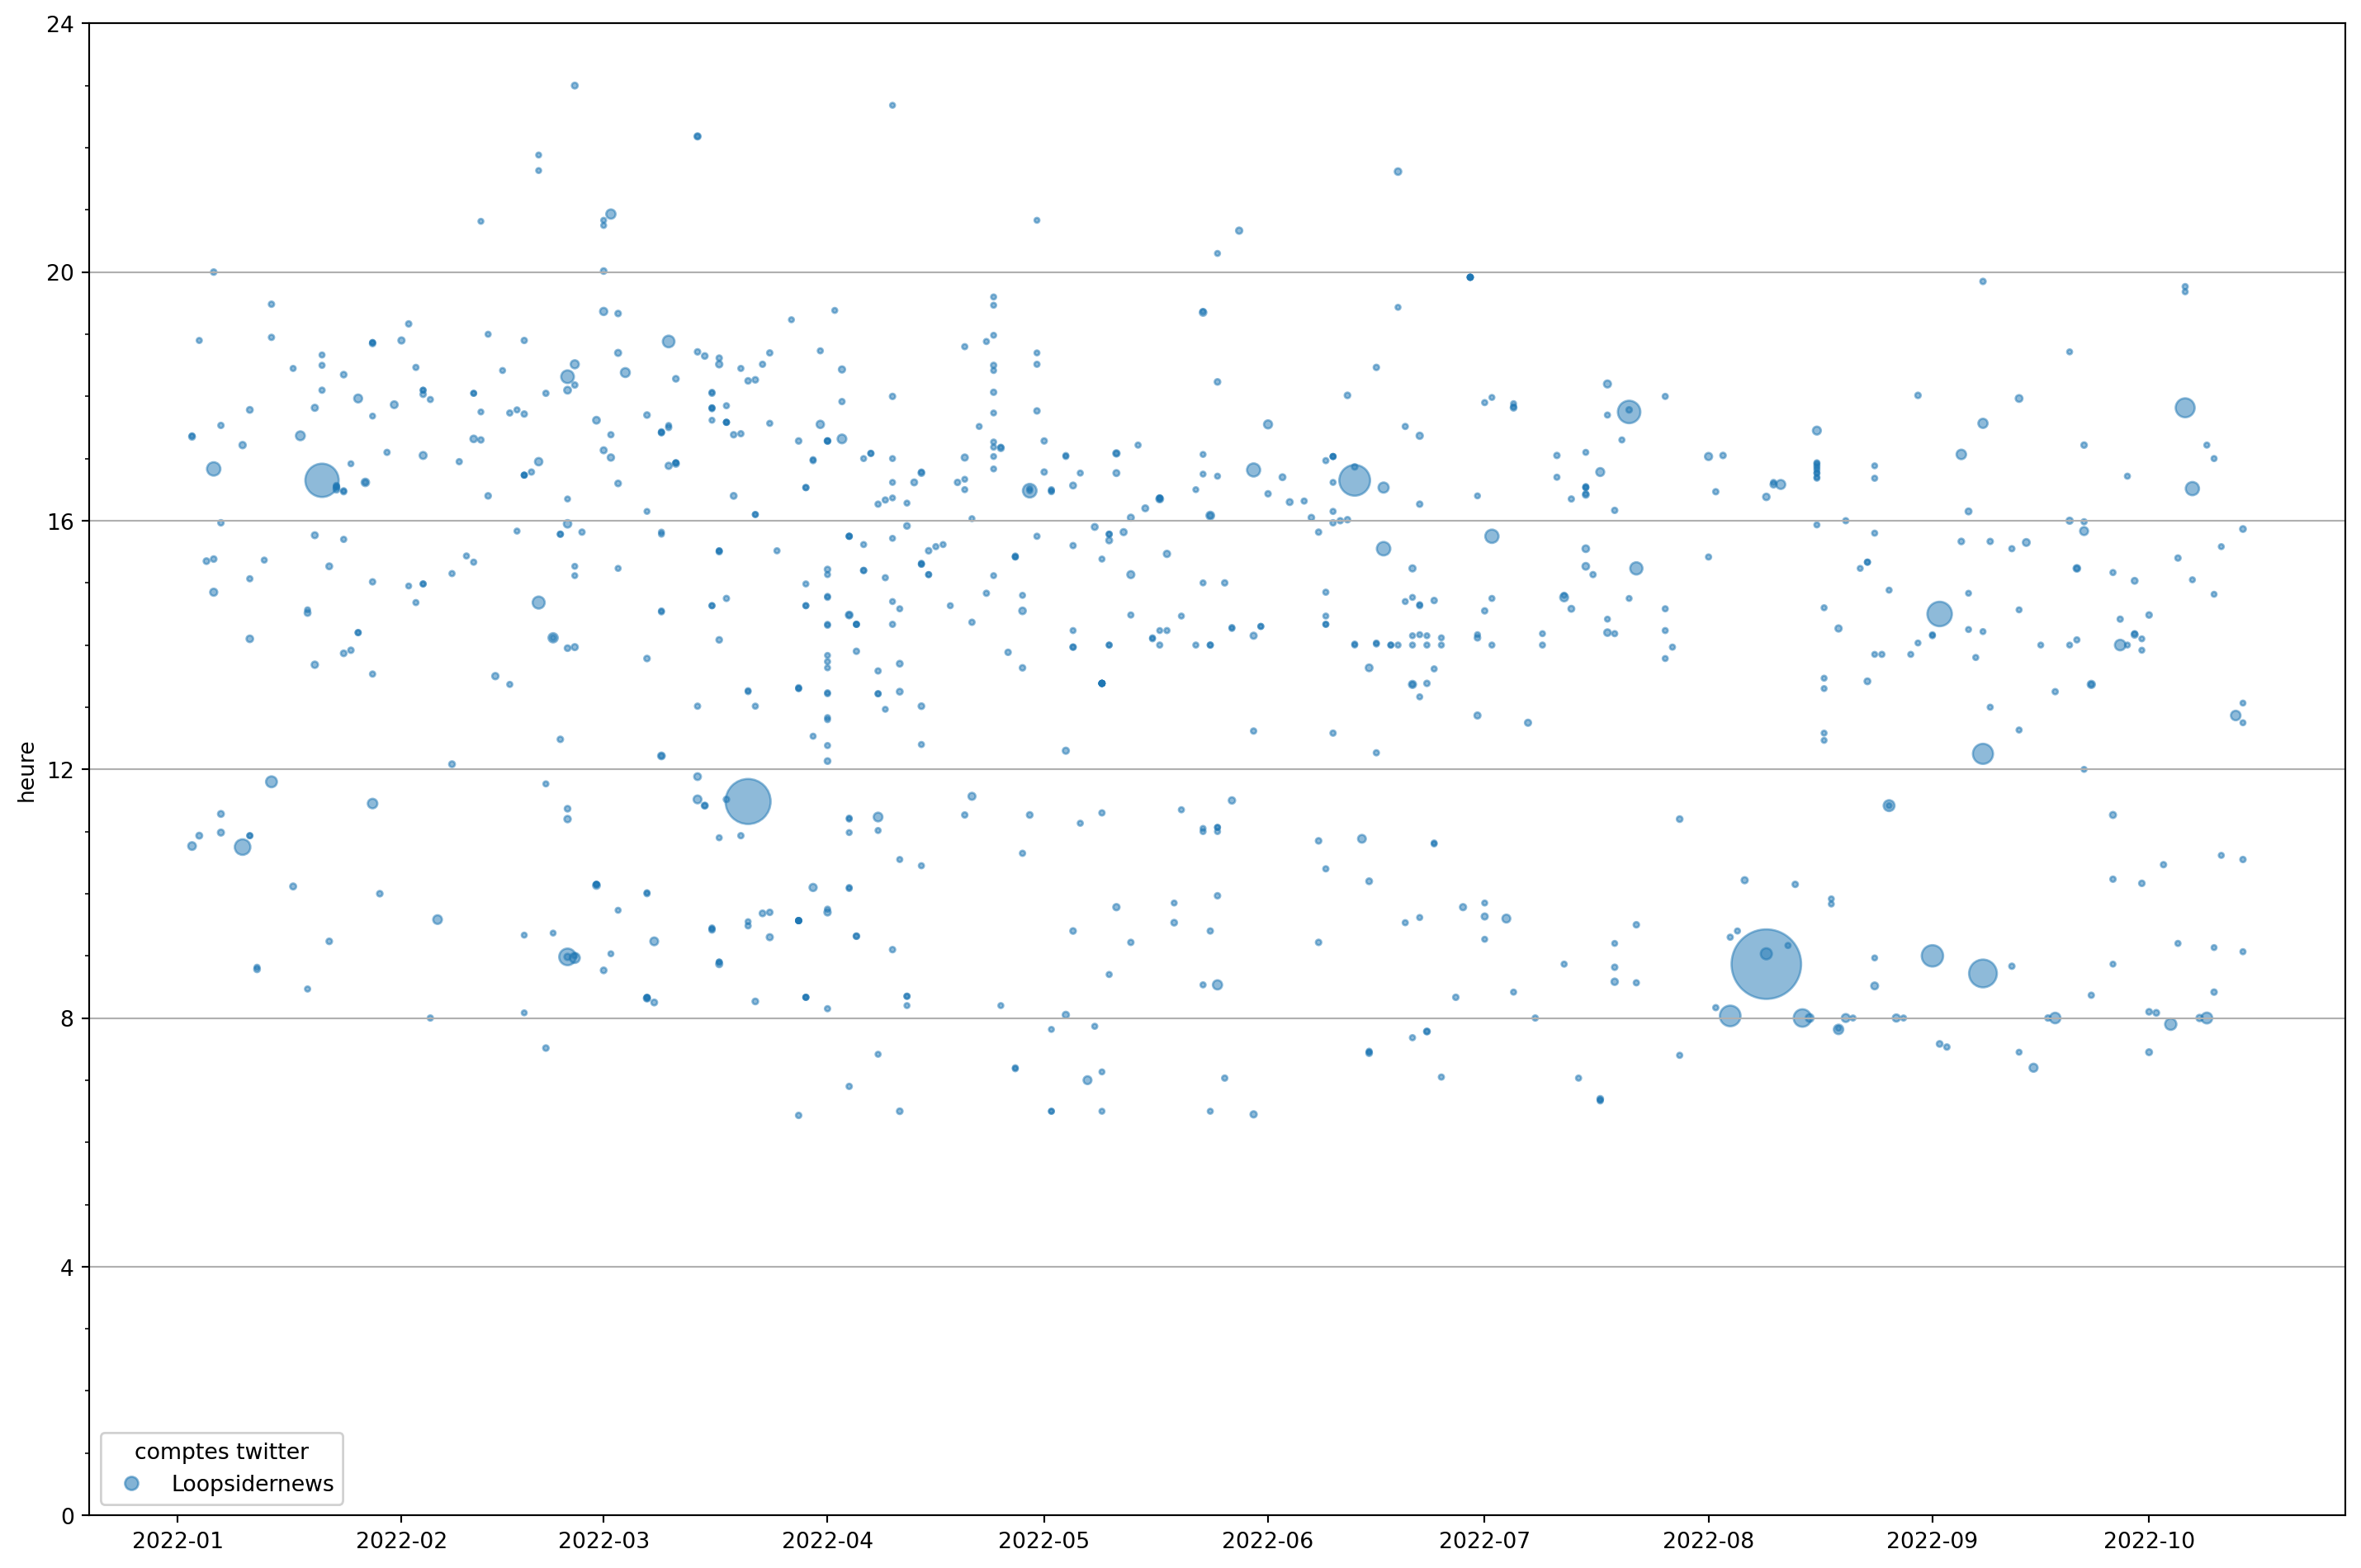
--- author: tam kien duong output-file: twitter-noise.html execute: echo: false jupyter: jupytext: formats: 'ipynb,qmd:quarto' text_representation: extension: .qmd format_name: quarto format_version: '1.0' jupytext_version: 1.14.1 kernelspec: display_name: Python 3 (ipykernel) language: python name: python3 --- # Twitter : bruit ou information ? ```{python} import pandas as pdimport matplotlib.pyplot as pltimport matplotlib as mptimport numpy as np``` ```{python} = ('datasets/tweets.par' )``` ```{python} = (15 ,10 )``` ```{python} def timeline(df, ax):= ax.scatter(= df.local_time.dt.date,= df.local_time.dt.hour* 60 + df.local_time.dt.minute,= np.interp(df.retweet_count, (0 , tweets.retweet_count.max ()), (5 , 1000 )),#label=df.user_screen_name.tolist(), = 0.5 ,= df.user_screen_name.cat.codes,= 'tab10' 'heure' )0 , 24 * 60 )= ax.legend(scatter.legend_elements()[0 ], df.user_screen_name.unique(), loc= "lower left" , title= "comptes twitter" )= scatter.legend_elements(prop= "sizes" , alpha= 0.6 )#legend2 = ax.legend(handles, labels, loc="lower right", title="retweets") return scatterdef show_timeline(account):= plt.subplots()* figsize)#fig.set_dpi(600) f'user_screen_name.isin(@account)' ), ax)4 * 60 ))lambda x,pos: ' {:0.0f} ' .format (x/ 60 ))60 ))= 'y' )``` ## Vue d'ensemble ```{python} #| layout-ncol: 1 = plt.subplots()* figsize)4 * 60 ))lambda x,pos: ' {:0.0f} ' .format (x/ 60 ))60 ))= 'y' )'graphics/timeline-raw.png' ); ``` ## Le Monde ```{python} #| layout-ncol: 1 'lemondefr' ])``` ## Mediapart ```{python} #| layout-ncol: 1 'Mediapart' ])``` ```{python} #| layout-ncol: 1 'MediapartBlogs' ])``` ## Brut et Loopsider ```{python} #| layout-ncol: 2 #| fig-cap: #| - Brut #| - Loopsider 'brutofficiel' ])'Loopsidernews' ])```